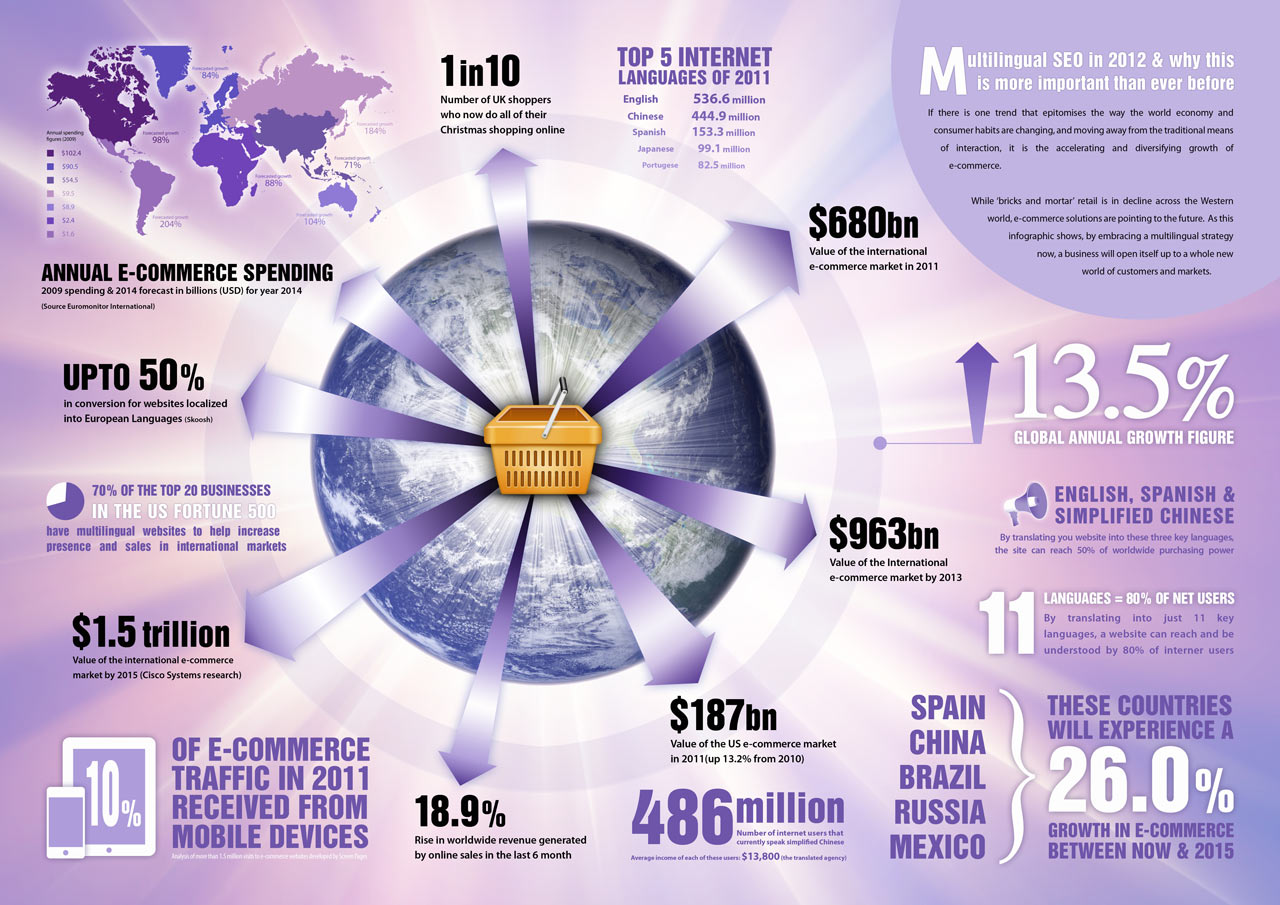
Being an entrepreneur sometimes we need to use statistics, we need a detailed analysis of the market. Leading companies, are pioneers in the field are often at the reports of sales, profits and losses incurred. Information Companies create comparative reports, emerging leader. This way the customer can check which company excels over the other in a particular industry.
It definitely makes it easier to decide on the services of the company. First of all, builds trust. For such a report was clear and easy to interpret should be used in the process of its creation infographics.
Infographics is a coherent combination of information and visualization. Infographics is clear then, as it makes it easy to associate. It refers to the sense of sight. The human eye is focused on the shapes and colors, and therefore the development of graphic information must be primarily aesthetic. The accumulation of too much detail will make the message is neither clear nor readable.
Infographics are all the diagrams, statistical bars and wheels, tables divided into colors, and all other artistic differences. What are the benefits of the use of infographics?
The main advantage is the ease of assimilation of the statistical data. The data are better understood and remembered when they are shown in graphical form than the one within. Media content becomes more accessible to the recipient. It is also more attractive and the recipient does not alienate the accumulate of numbers and percentages.


